
North Bay Housing Market Update May 2026
Dena Bliss May 21, 2026
Dena Bliss May 21, 2026
Marin and Sonoma Counties led the North Bay market with year-over-year price growth.
Solano and Napa Counties continued to experience modest price softening.
Inventory remains significantly below 2025 levels across both homes and condos.
Single-family homes are selling quickly throughout most of the region.
Median sale price: $1,905,000
Year-over-year change: +4.38%
Median sale price: $870,000
Year-over-year change: +2.35%
Median sale price: $579,000
Year-over-year change: -1.78%
Median sale price: $905,000
Year-over-year change: -3.72%
Year-over-year change: +11.44%
Year-over-year change: +8.21%
Year-over-year change: +2.61%
Year-over-year change: -13.92%
Active inventory: 2,481 homes
Year-over-year inventory decline: -36.98%
Active inventory: 347 units
Year-over-year inventory decline: -24.57%
Single-family home sales increased 9.01% year-over-year
Condo sales increased 11.24% year-over-year
April recorded:
980 single-family home sales
988 new single-family listings
Supply and demand remain tightly balanced, continuing to support pricing in high-demand markets.
13 days
Unchanged from last year
26 days
Improved 10.34% year-over-year
26 days
Improved 10.34% year-over-year
54 days
Slower market pace with a 63.64% increase in days on market
Napa County condos are selling 31.25% faster than last year
Sonoma and Solano County condos are taking approximately 19% longer to sell
2.2 months of supply
Year-over-year decline: -53.19%
2.6 months of supply
Year-over-year decline: -23.53%
2.8 months of supply
Year-over-year decline: -48.15%
6.0 months of supply
Year-over-year decline: -33.33%
Marin County: 3.8 months
Sonoma County: 3.8 months
Solano County: 4.1 months
Napa County: 5.6 months
Condo markets remain more balanced and buyer-friendly than single-family homes
Inventory is tightening across the region, even within the condo segment
Marin and Sonoma Counties continue leading the North Bay’s price growth.
Tight inventory remains the dominant theme across the market.
Single-family homes remain firmly in seller’s market territory.
Condo buyers still have more negotiating leverage, though conditions are tightening heading into summer.


Both electrical outlets and light switches have the potential for air leakage if not properly sealed.

For homes with multiple levels, stairs are a part of this equation.
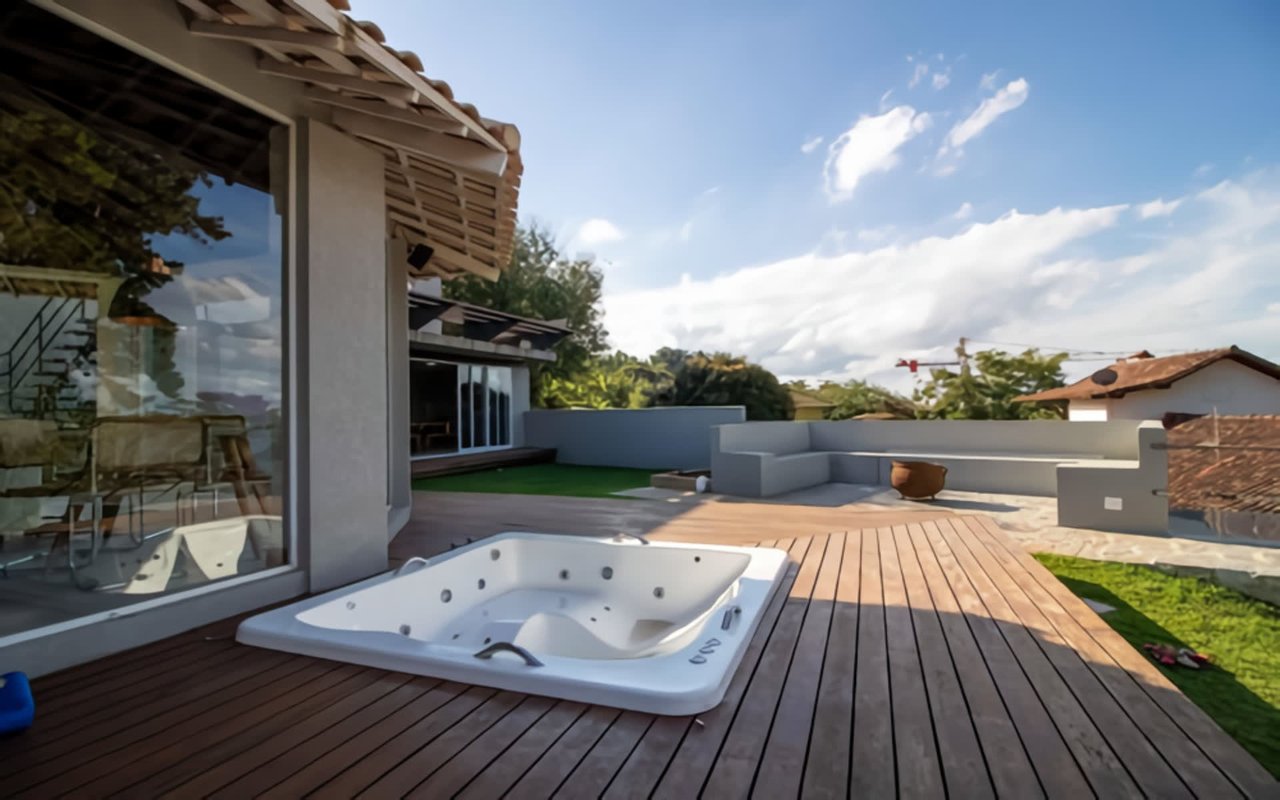
It’s crucial to think beyond the basics and choose the best design for your lifestyle.

What's the difference between an above ground pool and an in-ground pool for insurance coverage?

It’s crucial to understand each loan type and its definition.
Whether you're a first-time buyer, a single parent, or seeking an investment opportunity, Dena is here to guide you.


